
OR-10-003 -- Top-Level Energy and Environmental Dashboard for Data Center Monitoring
Conference Proceeding by ASHRAE , 2010
Magnus K. Herrlin, PhD; Craig M. Compiano
Most Recent
-
-
Available Formats
- Options
- Availability
- Priced From ( in USD )
-
Available Formats
-
- Immediate download
-
$16.00Members pay $7.00
- Add to Cart
Customers Who Bought This Also Bought
-
OR-10-053 -- Moving Ducts into Conditioned Space; Getting...
Priced From $16.00 -
OR-10-023 -- What's Creeping Around in Your Data Center?
Priced From $16.00 -

OR-10-004 -- System Architectures and Fluids for High Hea...
Priced From $16.00 -
OR-10-005 -- High Density Cooling Solutions-Taking IT to ...
Priced From $16.00


About This Item
Full Description
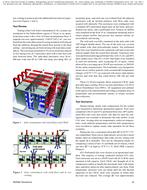
This paper presents a top-level energy and environmental dashboard for data center monitoring. It consists of four gauges: one for infrastructure energy efficiency, two for ITequipment intake air temperature compliance, and one for air management effectiveness. The color-coded dials indicate good, acceptable, and poor operation. The overall goal is to move all four analog needles towards the 12 o’clock position— representing ideal operating conditions. In addition, the operator can select both the averaging period and the sampling frequency for the readings. A glance at this dashboard provides instant visual information on the operational status of the data center. This strikingly simple presentation is made possible by utilizing selected non-dimensional performance metrics to intelligently summarize a large amount of data and avoid operator fatigue. The dashboard also has a warning icon for each gauge for out-of-bound data as well as access to detailed data when needed.
Units: Dual
